
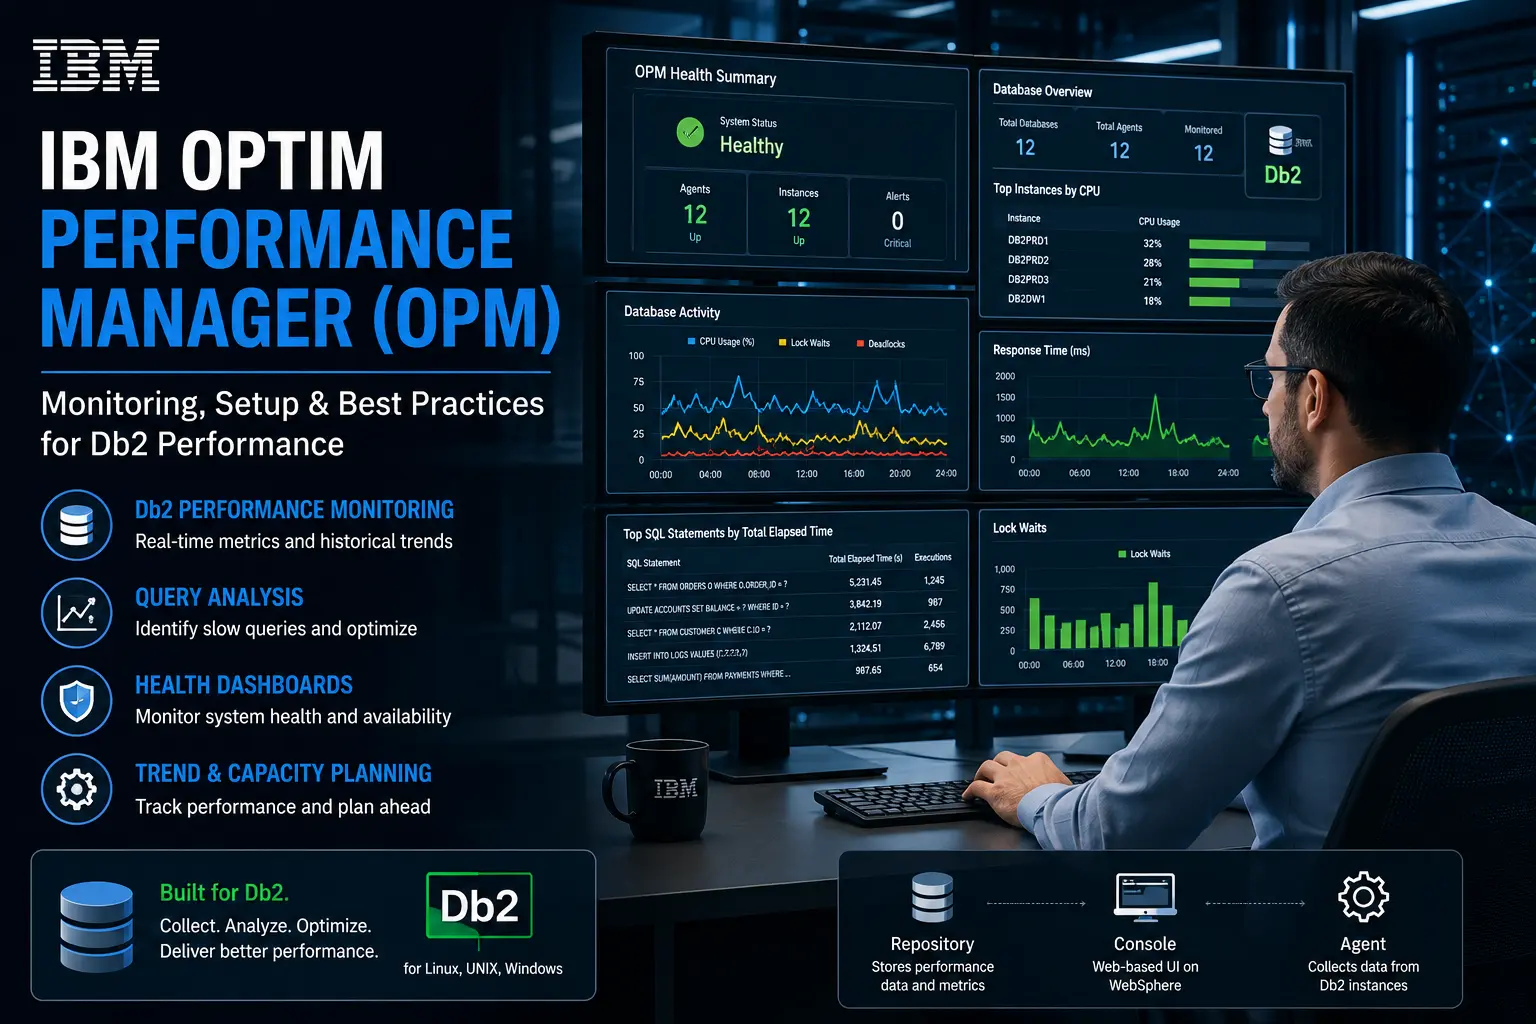
If you’re reading this, you’re probably staring at a Db2 environment that needs monitoring, and someone mentioned Optim Performance Manager (OPM) as the tool for the job. Maybe you inherited it from a predecessor. Maybe you’re migrating off Db2 Performance Expert. Either way, you need to know what it is, whether it’s still worth deploying, and how to get a database connected without guessing your way through it.
This guide covers all of that, including the parts most write-ups skip: what OPM can’t do, where people actually get stuck, and how to decide whether it’s the right tool for your situation at all.
A note on sourcing: the architecture, configuration parameters, and setup sequence below reflect IBM’s published documentation and standard Db2 administration practice. Exact defaults, menu labels, and URLs vary between OPM versions (4.1 through the 5.x InfoSphere releases), so treat this as a working framework and confirm version-specific details against IBM’s current documentation for your release before you execute in production.
What Optim Performance Manager Actually Is
IBM Optim Performance Manager (originally part of the InfoSphere suite) is a web-based monitoring and diagnostic tool built specifically for Db2 for Linux, UNIX, and Windows. It replaced Db2 Performance Expert, and its job is narrow but deep: watch your Db2 instances, store what it sees, and give you a console to figure out why something’s slow before a user files a ticket about it.
This is not a general-purpose observability platform. It doesn’t monitor your application servers, your network, or your container orchestration layer unless you pair it with Extended Insight — and even then, Extended Insight’s visibility is limited to the transaction path it’s instrumented to watch, not full-stack tracing. Know that boundary going in, because expecting OPM to behave like a modern APM tool is the single most common source of disappointment with it.
Who Should Use This — and Who Shouldn’t
Be honest with yourself before you invest setup time.
OPM is a reasonable choice if:
- You’re already running it and it’s stable — there’s rarely a good reason to rip out working monitoring just because it’s not the newest option.
- You’re on an older Db2 version where a newer tool’s feature coverage isn’t there yet.
- You specifically need Extended Insight’s transaction-timing correlation and haven’t found an equivalent in whatever you’d replace it with.
- You’re mid-migration from Db2 Performance Expert and OPM is the documented bridge path IBM points you to.
OPM is probably the wrong choice if:
- You’re standing up Db2 monitoring from scratch on a current deployment. IBM has positioned Data Server Manager as its more actively maintained direction for Db2 management — evaluate that first rather than defaulting to OPM out of habit or old documentation.
- Your environment is heterogeneous (Db2 plus Oracle, SQL Server, PostgreSQL, etc.) and you need one pane of glass. OPM only sees Db2. You’d be running a second console anyway.
- You need cloud-native or containerized Db2 visibility. OPM’s architecture assumes traditional server deployment; if your Db2 instances are running in containers or Db2 on Cloud, confirm compatibility before committing time to this path — don’t assume it works the same way.
- Your team doesn’t already have WebSphere Application Server expertise (or the willingness to run the embedded lightweight server) and you’re not prepared to take that on as an added maintenance burden.
If you’re unsure which bucket you’re in, the fastest test is this: if someone asked “why did Db2 slow down at 2pm yesterday” and you have no historical baseline to compare against, that’s the exact problem OPM is built to solve. If the question is closer to “why did our whole application stack slow down,” OPM alone won’t answer it.
Architecture: The Three Pieces That Have to Work Together
OPM is built on three components. Understanding how they relate to each other will save you most of your troubleshooting time later, because nearly every setup failure traces back to a break between two of these three.
| Component | What it does | Where it lives |
|---|---|---|
| Repository | A dedicated Db2 database that stores every metric OPM collects — this is what enables trend analysis, baselining, and historical comparison instead of just live snapshots | Runs on its own Db2 instance, separate from the databases being monitored |
| Console | The web interface you actually interact with — dashboards, health summaries, the Task Launcher, configuration wizards | Hosted on WebSphere Application Server (or an embedded lightweight server in later versions) |
| Agent (Data Collector) | Connects directly to each monitored Db2 instance, turns on the monitor switches, and streams metrics back to the repository | Runs alongside each monitored Db2 instance |
One server can manage multiple remote Db2 instances through this model. That’s the point of the architecture — you’re not logging into ten separate boxes to check ten separate databases. But it also means an agent-to-instance deployment tax exists at scale: every new Db2 instance you monitor needs its own agent, correctly matched by instance name, correctly authorized. That overhead is worth factoring into a “should we adopt this” decision if you’re managing dozens of instances rather than a handful.
Before You Touch the Console: Prerequisites
Skipping this section is the single most common reason setups fail halfway through. Confirm all four before you open a browser.
- A supported Db2 version. Version-specific quirks exist between 4.1 and the 5.x InfoSphere releases — don’t assume steps or defaults from one version’s documentation apply cleanly to another.
- SYSADM authority on the Db2 instance you’re going to monitor, for the user ID doing the configuration. Without it, the agent can’t enable the monitor switches it needs, and you’ll get partial or silent data gaps rather than a clear error.
- Repository database provisioned — either created fresh or pointed at an existing Db2 database designated for this purpose, with disk capacity planned around your intended retention window, not just whatever’s available today.
- Correct Db2 configuration parameters set — covered in the table below. This is not optional checkbox work; if these are wrong, OPM will run but the data it shows you will be unreliable, which is arguably worse than no data at all because it looks trustworthy.
Db2 Configuration Parameters OPM Needs
| Parameter | Purpose | Recommended Setting |
|---|---|---|
DB2_EVALUNCOMMITTED | Improves data handling accuracy for monitored queries | ON |
DB2_SKIPDELETED | Keeps the repository stable during collection | ON |
AUTO_RUNSTATS | Ensures OPM’s query analysis is working from current statistics, not stale ones | ON |
sheapthres | Enables self-tuning of sort memory heap | 0 (automatic) |
ASLHEAPSZ | Prevents rejected remote block cursor requests during high-volume collection | Tuned to workload — don’t leave at default on busy systems |
AUTO_RUNSTATS is the one people skip and regret. If Db2’s statistics are stale, every piece of query analysis OPM shows you is built on bad inputs — the tool will report confidently and be wrong, and you won’t know it’s wrong until you’ve already acted on it.
Setting Up Your First Monitored Database
This is the sequence, in order, with the failure points called out where they actually happen.
Step 1 — Log into the console
This runs through WebSphere (or the embedded server, depending on version) at the address set during installation. If you don’t have it, it’s in your installation notes — it’s not something you can guess your way to.
Step 2 — Open the Task Launcher and select “Add and configure a database for monitoring
This starts the guided connection wizard.
Step 3 — Enter connection details
hostname, port, database name, and the monitoring user ID (the one with SYSADM authority from your prerequisites check). A typo here is the most common single point of failure in the entire setup — OPM won’t throw a particularly helpful error, it’ll just fail to connect, and you’ll spend time debugging the wrong layer.
Step 4 — Run the Monitoring Configuration Wizard
You’ll set three things here, and they trade off against each other:
- Data collection interval — shorter intervals give you finer-grained diagnostics but cost more overhead.
- Monitoring level — how deep the collection goes.
- Retention time — how long historical data stays in the repository before it’s pruned.
Don’t default to “collect everything, keep it forever.” That’s how repositories balloon and performance analysis gets slower, not faster. Match the settings to what you’re actually trying to diagnose.
A realistic scenario: say you’re handed a production OLTP database and told monitoring needs to be live before a scheduled load test next week. The instinct is to set the shortest interval and deepest monitoring level available “to be safe.” Resist that. Deep, frequent collection on a system you haven’t baselined yet adds load exactly when you can least afford to muddy the results. Start at a moderate interval, confirm the load test’s normal behavior, then tighten collection only around the specific metrics the test is meant to validate.
Step 5 — Decide on Extended Insight
If your license includes it, the wizard will show whether it’s active. If it isn’t — which is common on migrations from Db2 Performance Expert, since that tool didn’t have an equivalent — you’ll need to run the Extended Insight Activation Kit separately. Extended Insight isn’t required for OPM to function; it adds client-to-database transaction timing on top of core Db2 monitoring. Skip it if you don’t need cross-tier visibility; activating a feature you don’t need adds operational surface area without benefit.
Step 6 — Deploy the Data Collector agent
Run the configuration script pointed at the instance you’re monitoring, using the exact instance name — mismatches here are the top cause of “the setup worked but no data shows up.” The user starting the agent needs the same SYSADM authority as the configuration user; if it was configured by one account and started by another without matching privileges, collection silently fails rather than erroring loudly.
Step 7 — Validate
Go back to the Health Summary dashboard and check three things: alert state (should read normal, not “attention” or “warning”), the latest data timestamp (should be current, not stale), and whether metrics are updating on the interval you configured. If all three check out, you’re done. If any one is off, don’t proceed to build dashboards on top of it — fix the data pipeline first.
Common Mistakes That Aren’t Obvious Until You’ve Made Them
- Treating the configuration account and the runtime account as interchangeable. They often aren’t the same identity, and OPM doesn’t always surface that clearly when it’s the cause of missing data.
- Assuming instance-level monitoring like older tools. OPM targets specific databases, not entire instances by default. If you expect blanket instance coverage the way legacy tools provided it, you’ll miss databases you assumed were included.
- Setting maximum retention “just in case” without a pruning schedule. The repository is a real database with real storage limits — plan pruning before you need it, not after a disk-space alert.
- Skipping AUTO_RUNSTATS because “it’s already on somewhere.” Confirm it’s on for the specific databases being monitored, not just set as a general instance default that might not apply everywhere you think it does.
- Activating Extended Insight by default. It’s easy to treat it as “more visibility is always better,” but it adds components to install, license considerations to track, and another thing that can fail silently if client-side modules aren’t deployed correctly.
Limitations to Plan Around
- Db2-only. If your stack includes other database engines, OPM won’t unify visibility across them.
- No native full-stack tracing without Extended Insight, and even then it’s transaction-path timing, not the kind of distributed tracing you’d get from a modern APM tool.
- WebSphere dependency in earlier versions adds a real operational footprint — patching, resource allocation, and troubleshooting WebSphere itself becomes part of your responsibility, not just Db2.
- Sparse recent official documentation. Much of what’s publicly available dates back several years, which means edge cases and newer Db2 version interactions may not be well documented anywhere. Budget extra time for trial-and-error on anything outside the core, well-trodden setup path.
- Per-instance agent deployment doesn’t scale effortlessly — at high instance counts, the operational overhead of managing agents individually becomes a real cost, not just a one-time setup task.
Warnings Before You Deploy to Production
- Don’t enable the deepest monitoring level on a production system without first testing overhead on a non-production instance with comparable load. Monitoring itself consumes resources; find that cost before you’re troubleshooting a slowdown you accidentally caused.
- Don’t assume Extended Insight is included in your license. Licensing structures for IBM software change and vary by agreement — confirm entitlement before you plan a rollout around a feature you may not actually have.
- Don’t run the agent under an account with SYSADM authority “temporarily” and forget to lock that down afterward. It’s a common shortcut during setup that becomes a lingering security gap.
- Don’t treat OPM’s alerts as a substitute for testing changes before deploying them. It will tell you something degraded; it won’t tell you it’s about to, in most standard configurations.
Troubleshooting: What Actually Goes Wrong and Why
| Symptom | Root Cause | Fix |
|---|---|---|
| No data in console at all | Monitor switches not enabled, agent not running, or firewall blocking the default port range (55000-series) | Confirm agent process status first, then check monitor switches, then check port access |
| Agent runs but data doesn’t appear | Instance name in agent config doesn’t match the actual Db2 instance name | Re-check the exact instance name used during agent configuration — this is a string match, not a “close enough” match |
| Permissions/authority errors | User starting the agent lacks SYSADM authority | Confirm the runtime user, not just the configuration user, has SYSADM — these can be different accounts |
| High lock waits reported constantly | Usually a real application/schema issue, not an OPM problem | Use the Locking Analysis view to identify holders vs. waiters, then fix at the application or index level — OPM surfaces the problem, it doesn’t fix it |
| Extended Insight data incomplete | Client-side components not installed or not communicating with the server | Verify the Extended Insight Activation Kit ran successfully and client modules are deployed on the application servers, not just the Db2 server |
| Repository growing too large | No pruning schedule set, retention set too long for data volume | Set an explicit pruning schedule and revisit retention settings against actual disk budget |
| Dashboards look “stale” after a config change | Cached wizard settings not fully applied, or agent needs a restart to pick up new collection parameters | Restart the agent after any collection-level configuration change rather than assuming it applies live |
If you’ve checked everything in this table and data is still missing, the next step is confirming the issue isn’t upstream — network connectivity or firewall rules between the agent and repository are a frequent cause that looks like an OPM configuration problem but isn’t.
A Decision Framework: OPM, Data Server Manager, or Something Else
Rather than a blanket recommendation, work through this in order:
- Is your environment Db2-only? If no, and you need unified visibility across multiple database engines, a cross-vendor tool (SolarWinds DPA, or a full observability platform) is worth evaluating over OPM regardless of anything else below.
- Are you deploying fresh, or maintaining an existing OPM install? Fresh deployments should default to evaluating Data Server Manager first, since that’s IBM’s more current direction. Existing, stable installs don’t need to migrate just for the sake of it.
- Do you need Extended Insight specifically, or just core Db2 metrics? If it’s just core metrics, don’t let Extended Insight’s availability be the deciding factor in your tool choice.
- How many instances are you managing? A handful — OPM’s per-instance agent model is manageable. Dozens or more — factor in the real operational overhead of that model before committing.
- Do you already have WebSphere expertise in-house, or are you willing to take it on? If not, and your OPM version requires it, that’s a genuine cost to weigh against the tool’s monitoring depth.
There’s no single right answer here — the honest recommendation depends on which of these constraints actually apply to your environment, not on which tool is newest.
FAQs
Do I need SYSADM authority to set up OPM?
Yes, for both the account that configures monitoring and the account the agent runs under. These need to match in privilege level, and they’re sometimes different accounts — check both.
Can one OPM console monitor multiple Db2 instances?
Yes. That’s the core design — one repository and console, multiple agents reporting in from separate instances. Just budget for the per-instance agent overhead at scale.
Is Extended Insight required?
No. Core Db2 monitoring works without it. Extended Insight adds end-to-end application-to-database transaction timing, useful if you need to trace latency across tiers, not just inside Db2 — but confirm it’s included in your license before planning around it.
Why is no data showing up after setup?
In order of likelihood: the agent isn’t actually running, the instance name in the agent config doesn’t match the real Db2 instance name, or the runtime user lacks SYSADM authority. Check all three, plus network/firewall connectivity between agent and repository, before assuming it’s a deeper bug.
Does monitoring itself slow down the database?
There’s overhead, and it scales with your collection interval and monitoring level. Test it on a non-production instance with representative load before committing to aggressive settings on production.
Should I migrate to IBM Data Server Manager instead?
If you’re deploying fresh, evaluate Data Server Manager first. If you’re already running OPM successfully and it meets your needs, there’s no forcing function to migrate immediately — weigh it against the decision framework above rather than defaulting either direction.