
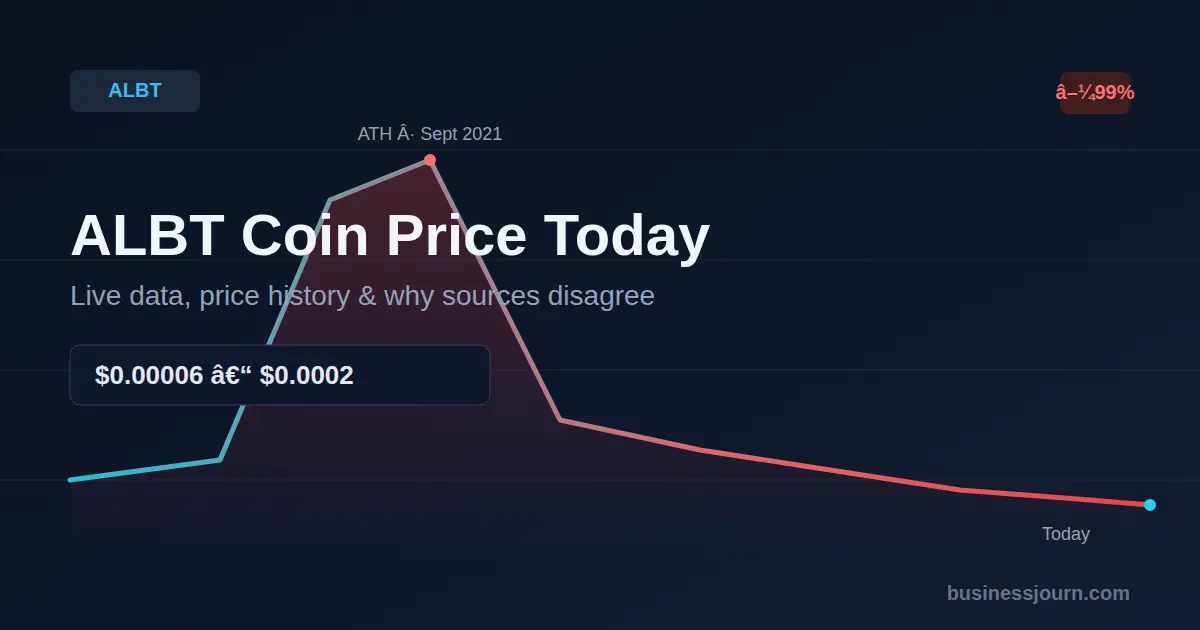
ALBT is currently trading somewhere between $0.00006 and $0.0002, and which number you see depends entirely on which exchange or tracker you check. That’s not rounding error — it’s a multi-fold spread on a token priced in fractions of a cent. Daily trading volume has fallen to single- and double-digit dollar amounts on several exchanges, which is too thin for prices to line up the way they do for actively traded coins.
Search “ALBT coin price” and you’ll notice something odd fast: every site quotes a different number. One tracker says $0.00006. Another says $0.0001. A third shows $0.00 flat. That’s not a typo, and you’re not misreading a decimal — it’s the actual state of this token, and it tells you more about where ALBT stands than any single price could.
This isn’t a beginner’s guide to what a ticker is. You already know that. What you need is a straight read on where ALBT actually stands — price, liquidity, project status, and what your realistic options are if you’re holding it.
ALBT Price Today
Pulled from multiple live trackers at the time of writing, ALBT sits somewhere between $0.00006 and $0.0002. That spread — several times over, not a few cents’ difference — is the story here.
| Source | Quoted Price (at time of check) | Notes |
|---|---|---|
| LiveCoinWatch | $0.000060 | Down 2.24% in 24h |
| CoinDesk | ~$0.0000058 | 24h volume: $59.97 |
| Coinbase | $0.000059 | Standard exchange feed |
| CoinLore | $0.0000840 | Includes deep historical stats |
| Crypto.com | $0.00 shown, $0.0001408 elsewhere on same page | Internally inconsistent — flagged, not resolved |
| Delta | $0.0000517 | 24h volume: $14.45 |
Why Every Site Shows a Different ALBT Price
Here’s what most price pages skip over.
Trackers pull data straight from exchanges. On an actively traded coin — Bitcoin, Ethereum — thousands of trades happen every minute across dozens of venues, and arbitrage keeps prices in line. If Coinbase priced BTC 5% below Binance, traders would buy on Coinbase and sell on Binance until the gap closed.
ALBT no longer has that mechanism. At $14–$60 in daily volume on some venues, there simply aren’t enough trades to keep prices aligned across platforms. A single $20 sell order can move the “last price” on a thin exchange by a meaningful percentage, and that stale, skewed print gets pulled into aggregator feeds and published as “the price.”
The mechanism, step by step:
- A holder places a small sell order on Exchange A.
- It fills against the only buyer around, at whatever that buyer’s willing to pay — possibly well below Exchange B’s last traded price.
- Exchange A’s last price now reflects one trade, not a consensus.
- Trackers pull that number and publish it as “the ALBT price.”
- Exchange B, with no recent trades at all, still shows its own stale figure.
- You end up looking at two “current” prices that differ by 2–5x, and neither is wrong — they’re accurate snapshots of two disconnected micro-markets.
This isn’t a data error. It’s what happens to any asset once volume drops below the level price discovery needs to function.
Liquidity Tiers: Where ALBT Sits
| Tier | Daily Volume (approx.) | What It Means for You |
|---|---|---|
| High liquidity | $100M+ | Prices align across exchanges within seconds; large orders barely move price |
| Medium liquidity | $1M–$100M | Minor gaps possible; still tradeable at scale |
| Low liquidity | $10K–$1M | Noticeable slippage on larger orders; prices can diverge across venues |
| Near-zero liquidity (ALBT’s current range) | Under $100 on several tracked venues | A single trade can swing the quoted price; cross-exchange prices routinely disagree |
Common mistake: treating the first Google result as “the real price.” At ALBT’s liquidity level, there is no single real price — just a cluster of prices across disconnected markets. The honest answer is a range.
ALBT Key Stats: Market Cap, Supply, and Volume Explained
Price alone doesn’t mean much without supply context.
| Metric | Approximate Value | What It Tells You |
|---|---|---|
| Circulating supply | ~232M–461M ALBT (varies by tracker/date) | How many tokens are actually in the market |
| Max supply | 1,000,000,000 (1B) | The hard cap — supply can’t exceed this |
| Market cap | Roughly $23K–$550K across current trackers | Circulating supply × current price |
| Fully diluted valuation (FDV) | Max supply × current price | What market cap would be if every token were released |
| 24h volume | $14–$60 on multiple checked sources | How much actually traded hands in a day |
One outlier, excluded on purpose: MarketBeat shows a market cap of $15.53 million — dramatically higher than every other source. That figure is dated March 2023, before ALBT’s liquidity collapse, so it’s excluded from the range above. It’s flagged here only so you know why you might see it elsewhere.
Why circulating supply varies by source: trackers sync with the blockchain at different times, and some exclude tokens sitting in known dead wallets while others don’t. At ALBT’s scale, small counting differences move the reported figure noticeably.
Market cap vs. FDV — why the gap matters here:
If circulating supply is roughly 232–461 million out of a 1 billion cap, then 54–77% of total supply isn’t circulating yet. The market cap you see (based on circulating supply) understates the fully diluted picture — worth knowing for a token this illiquid, since it signals how much supply could theoretically hit the market later.
Illustrative example (not live data): at a hypothetical $0.0001 and 300,000,000 circulating:
- Market cap = 300,000,000 × $0.0001 = $30,000
- FDV = 1,000,000,000 × $0.0001 = $100,000
Over 3x apart — a meaningfully different headline depending on which figure gets used. Swap in live numbers for your own math.
ALBT All-Time High and Price History
ALBT peaked during the September 2021 DeFi/altcoin bull run. Sources disagree on the exact figure: CoinLore records $1.26 on September 6, 2021; KuCoin records $1.35 with no specific date. Treat both as approximate until confirmed against a primary source. From that peak to today’s $0.00006–$0.0002 range, ALBT has lost more than 99.98% of its value under either figure.
| Milestone | Date | Price |
|---|---|---|
| Launch | September 2020 (Sept 8, per MarketBeat) | Initial offering price not independently verified here |
| All-time high | ~September 2021 | $1.26 (CoinLore) or $1.35 (KuCoin) — unresolved discrepancy |
| Current range | 2026 | ~$0.00006–$0.0002 |
Is this decline unusual?
Partly. Plenty of 2020–2021 IEO/ICO-era tokens have dropped 90–99% from their peak — that part of the story is common. What sets ALBT apart isn’t the size of the drop; it’s the liquidity collapse layered on top of it. A coin can fall 99% and keep trading actively — many do. ALBT combining a near-total decline with near-zero volume is the more telling piece.
Is AllianceBlock (ALBT) Still Active?
This is the question most readers actually came for, and most price pages dodge it.
What we can say with confidence:
- Volume across multiple tracked exchanges sits at or near zero — single-to-double-digit dollar amounts in 24h volume on several platforms.
- BeInCrypto explicitly states it lacks reliable trading data for ALBT, citing limited liquidity or possible delisting.
- CoinCodex lists ALBT’s status as “Not Trading.”
- Contract addresses exist across four chains (Ethereum, BNB Smart Chain, Avalanche C-Chain, Polygon) — confirming the token still exists on-chain, at minimum.
What we can’t confirm from the data:
- Whether the AllianceBlock team is still actively building.
- Whether there’s been an official wind-down announcement.
- The current state of AllianceBlock’s website, socials, or team communications.
The honest answer: ALBT shows several hallmarks of a dormant market — collapsed volume, “Not Trading” status on one tracker, a data-reliability disclaimer from another. That’s not the same as confirming the company itself has shut down; we don’t have direct evidence either way. If project status matters to your decision, check AllianceBlock’s official channels directly. Price trackers report trades, not project health.
Signs a Crypto Project May Be Inactive — Checklist
- 24-hour volume consistently under $1,000 across major exchanges
- One or more major trackers show “Not Trading” or blank/N/A data fields
- No official updates, blog posts, or social activity in the past 6–12 months
- Delisted from exchanges that previously carried it
- Official website down, unmaintained, or redirecting elsewhere
ALBT meets at least two of these five based on the data gathered here. Verify the remaining three yourself before drawing a conclusion.
What Was AllianceBlock Built to Do?
Worth understanding what you’re actually holding, separate from the price story.
AllianceBlock launched in September 2020 (September 8, per MarketBeat), based in Utrecht, Netherlands, positioned as a bridge between traditional finance and DeFi — letting institutions and data providers tokenize and access financial products without building DeFi infrastructure from scratch.
ALBT served three stated functions:
- Medium of exchange — paying for access to datasets, financial instruments, and platform services.
- Reward mechanism — distributed to participants who contributed to the network.
- Governance token — voting and delegation within the ecosystem.
| Name | Role |
|---|---|
| Rachid Ajaja | Chief Executive Officer |
| Matthijs Vries | Chief Technology Officer |
| I.N.A. Ghaddar | Chief Investment Officer |
Backers listed as Faculty Capital and Vendetta Capital, with a reported security audit through CertiK — both per KuCoin’s project page only. These are checkable claims, but since they come from one source in our research, confirm them directly via CertiK’s site and the backers’ portfolios before citing as fact.
How to Verify You’re Looking at the Real ALBT Token
Low-liquidity, low-attention tokens get impersonated often. If you’re checking a balance, approving a transaction, or trading ALBT, verify the contract first.
| Chain | Contract Address (start) |
|---|---|
| Ethereum | 0x00a8b7… |
| BNB Smart Chain (BEP20) | 0x42f300… |
| Avalanche C-Chain | 0x9E037d… |
Before You Trade ALBT — Checklist
- Confirm the contract address on Etherscan, BscScan, or the relevant chain explorer — not just the exchange’s listing page
- Confirm the exchange is legitimate and the listing isn’t a spoofed pair
- Check live order book depth before assuming the quoted price is what you’ll get
- Use a limit order, not a market order, on any thin-volume exchange
Where Can You Trade ALBT Right Now?
Coinbase, KuCoin, and Crypto.com have all historically listed ALBT. Based on the volume data gathered here, actual activity across these venues ranges from minimal to effectively nonexistent.
| Exchange | Historically Listed | Current Activity Level (per research) |
|---|---|---|
| Coinbase | Yes | Price feed active; volume not confirmed as significant |
| KuCoin | Yes | Multiple stats fields shown as blank (“–“), suggesting limited current data |
| Crypto.com | Yes | Inconsistent price display observed (see price table above) |
| CoinDesk-tracked markets | Yes | 24h volume of $59.97 recorded |
Before placing any order: check that exchange’s live order book, not just its price page, to see how many buy/sell orders exist and at what spread. An empty book or wide bid-ask spread means significant slippage on anything beyond a very small trade.
Should You Trust ALBT Price Predictions?
You’ll find pages projecting ALBT at $0.74 by end of 2026, or gains past 7,000% by 2037. Worth understanding how those numbers get made before giving them any weight.
How predictions like this work: most crypto forecasting tools apply trend extrapolation, historical volatility patterns, and sentiment scoring to generate forward ranges — models built for assets with continuous, liquid trading data.
Why that breaks down for ALBT: CoinCodex generates these forecasts while simultaneously listing ALBT as “Not Trading.” Feeding a forecasting model data from a market that isn’t functioning still produces a number — just not a meaningful one. It’s forecasting tomorrow’s weather with a broken thermometer.
What we can responsibly say: there’s no reliable basis to forecast ALBT’s price in 2027, 2030, or 2040 — and neither does anyone publishing a specific figure, however precise it looks. Precision isn’t accuracy. A forecast stated to four decimal places can still rest on almost no real trading data.
Pros, Cons, and Limitations of Tracking ALBT
| Details | |
|---|---|
| Pros of the data available | On-chain contract addresses documented and verifiable across four chains; team, funding, and audit claims are at least checkable, not anonymous |
| Cons of the current market | Near-zero liquidity makes quoted prices unreliable; wide, unresolved disagreement across trackers; several stats fields blank or stale on major platforms |
| Limitations of this article | Founders, backers, audit, and exact ATH figure each rely on a single source and are flagged above for manual verification; current operational status couldn’t be directly confirmed either way |
| Risk if you act without verifying further | Transacting at a materially worse price than quoted, interacting with a spoofed contract, or basing a decision on stale project-status assumptions |
A Decision Framework for ALBT Holders and Traders
Not investment advice — a structured way to think through your own situation, whether you’re holding legacy ALBT or considering a new position.
If you’re an existing holder:
| Question | Why It Matters |
|---|---|
| Can I actually exit without major slippage? | Check the live order book before assuming you’ll get the quoted price |
| Do I have evidence the project is active, or am I assuming? | Check project status directly rather than guessing |
| Would a total loss on this position materially hurt me? | Given the liquidity and status signals here, total loss is a realistic scenario to plan around, not a remote one |
| Am I holding out of conviction, or because selling something illiquid feels like too much hassle? | Very different decisions follow from each — be honest about which applies |
If you’re considering a new position:
| Question | Why It Matters |
|---|---|
| Can I verify active, current project development? | Check official channels directly — don’t rely on price trackers for this |
| Do I understand these quoted prices aren’t reliably executable? | Revisit the liquidity section — the quoted price and the price you’d actually get can differ substantially |
| Am I treating this as speculation on illiquid on-chain history, not a fundamentals-driven investment? | Given the data gaps here, that’s the honest framing |
Bottom line: extremely low volume, “Not Trading” status on one tracker, a data-reliability disclaimer from another — that’s a liquidity and activity profile worth weighing carefully, whatever any single price figure shows. This is a framework for asking the right questions before you act, not financial advice.
FAQ
What is ALBT coin worth today?
Roughly $0.00006 to $0.0002, depending on the source, because of extremely low trading volume across exchanges. There’s no single reliable “exact” price at this liquidity level — see the price table above for a source-by-source comparison.
Is AllianceBlock (ALBT) still active?
Available data shows signs of a dormant market — near-zero volume, “Not Trading” status on one tracker — but no direct confirmation of an official shutdown either. Verify with AllianceBlock’s official channels for a definitive answer.
Why do different websites show different ALBT prices?
Because daily trading volume is extremely low, often in the tens of dollars. With that few trades, prices across exchanges don’t stay aligned the way they do for actively traded coins.
What was ALBT’s all-time high price?
Approximately $1.26–$1.35, reached around September 2021 during that year’s broader crypto bull run. Sources disagree on the exact figure and date — treat this as an approximate range pending further verification.
Where can I buy or sell ALBT?
Historically listed on Coinbase, KuCoin, and Crypto.com, but current trading activity on these venues is minimal based on the volume data gathered here. Check the live order book before trading, and use limit orders on thin markets.