
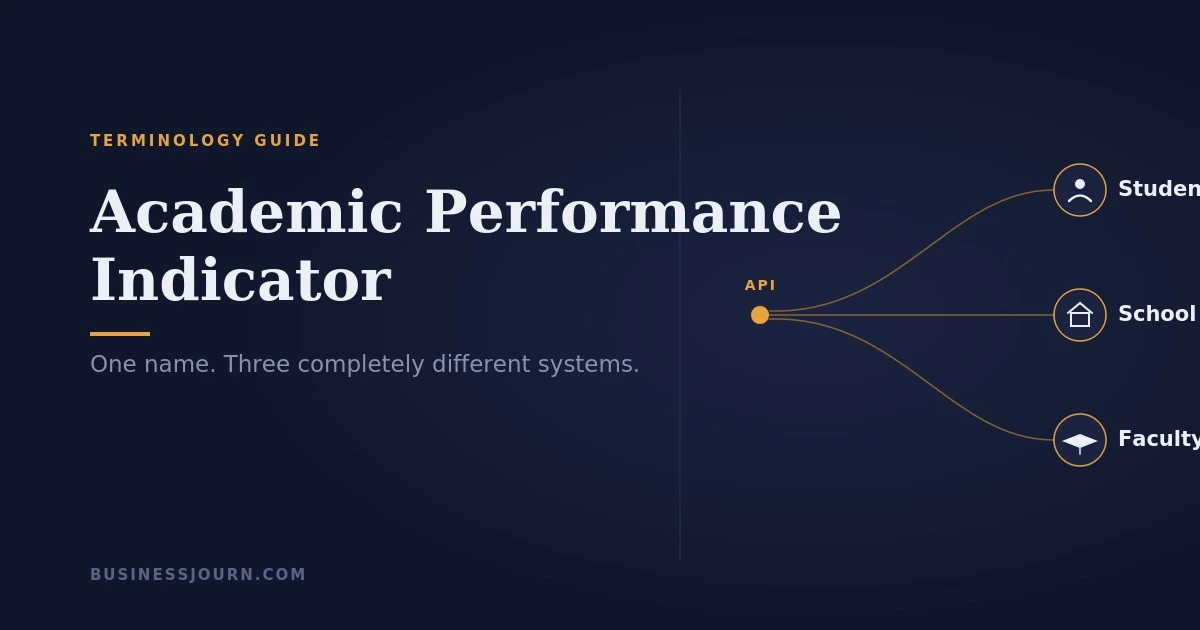
Academic performance indicator a metric used to measure student progress, here are five types, here’s why it matters. What almost none of them tell you is that the term covers three genuinely different systems. If you’re researching this for a school, a district, a promotion file, or your own curiosity, knowing which one you actually need will save you a lot of wasted reading.
Here’s the short version. An academic performance indicator can mean:
- Student-level metrics — GPA, test scores, attendance, and similar data used to track individual learning progress.
- A school or state accountability system — most famously California’s now-retired Academic Performance Index, a single score once used to rank and hold public schools accountable.
- A faculty scoring system — used mainly in Indian universities under UGC’s Career Advancement Scheme, where “API” is a points system tied to promotion.
The Definition Without the Circular Language
An academic performance indicator is a defined, measurable data point used to evaluate progress toward a learning or institutional outcome. The confusion around the term has nothing to do with the definition and everything to do with scale — the same phrase applies whether you’re tracking one student’s quiz average or scoring an entire state’s public school system.
What separates a real indicator from a vague one is specificity. It has to be something you can measure and compare over time. “Student engagement” isn’t an indicator. “Percentage of assignments submitted on time” is.
The System Most People Are Actually Searching For: California’s API
If you’ve seen “Academic Performance Index” written with a capital A and capital P, you’re almost certainly thinking of California’s old school accountability score, which ran from 1999 to 2013. It compiled standardized test results into a single number on a 200–1000 scale, with 800 set as the statewide target, and schools were publicly ranked against it — a ranking that directly affected funding and intervention decisions.
It no longer exists. California suspended the API in 2013 during the shift to Common Core-aligned testing, and by 2017 it had been formally replaced by the California School Dashboard, a multi-measure, color-coded system covering test scores, graduation rates, suspension rates, and English learner progress rather than one composite number. The Dashboard wasn’t a rebrand of the API — it was a direct response to criticism that reducing a school’s performance to a single figure oversimplified what “a good school” actually looks like.
If a source is still citing “API scores” for a California school today, that source is out of date. Look for Dashboard ratings instead.
The federal picture shifted alongside it. No Child Left Behind’s Adequate Yearly Progress requirements gave way to state-designed accountability plans under the Every Student Succeeds Act in 2015–2016, handing states — California included — more control over how school performance gets defined and reported.
Student-Level Indicators: What Schools and Parents Track Day to Day
Away from state accountability systems, “academic performance indicator” more commonly refers to the everyday metrics teachers use to monitor individual students.
Quantitative indicators are the easiest to compare: GPA, test scores, assignment grades. They’re also the easiest to over-rely on if treated as the whole picture. Behavioral indicators — attendance, homework submission consistency, time-on-task — often predict trouble before grades do. Districts increasingly flag chronic absenteeism, typically defined as missing 10% or more of school days, as an early-warning signal precisely because a student can be missing significant class time for weeks before it shows up in a report card.
Qualitative indicators, like teacher observations and rubric-scored participation, are harder to standardize but catch things test scores miss — a student who understands the material but freezes on timed exams, for instance. Skill-based indicators evaluate things like writing proficiency or problem-solving ability, usually through rubrics rather than a single score.
A student with a strong GPA but declining attendance is a different case than one with a weak GPA but perfect attendance and an improving trend line. A school tracking GPA alone misses both stories.
What an Indicator Report Actually Looks Like
Most schools that track student-level indicators report them in a fairly standard format: a rating scale (numeric out of 100, or letter grades), a breakdown by subject, a defined time period, and sometimes a categorical summary layered on top for quick reading.
A subject-level report might look like this:
| Subject | Grade | Attendance | Participation | Test Score |
|---|---|---|---|---|
| Mathematics | A | 90% | High | 95% |
| English | B+ | 85% | Moderate | 88% |
| History | A- | 92% | High | 90% |
Each column measures something different, and a student can look strong on one and weak on another. A report showing only the letter grade would hide the attendance and participation patterns that often explain why the grade landed where it did — a student sliding from 92% to 78% attendance in History, for example, is worth flagging even while the grade still reads “A-.”
Student KPIs vs Faculty KPIs: Don’t Mix These Lists
Generic explainers tend to treat “key indicators” as one undifferentiated list, but student and faculty indicators measure entirely different things.
For students, the relevant metrics are GPA or subject-specific grades, standardized or national exam results, participation and leadership in school activities, and the timeliness and quality of assignment submission. For faculty, the metrics shift to research output and citation impact, student evaluations and peer teaching reviews, teaching hours and instructional compliance, and participation in conferences and professional development.
Building a tracking system for a school calls for the first set. Evaluating instructors or preparing a promotion file calls for the second. Blend them into one generic list, as a lot of lower-quality content does, and you end up with a system that doesn’t serve either audience well.
How to Actually Calculate One
Here’s a simplified version of how a school might build a composite student performance score using weighted categories:
| Category | Weight | Example Score | Weighted Contribution |
|---|---|---|---|
| Test/exam average | 40% | 82/100 | 32.8 |
| Assignment completion | 20% | 95/100 | 19.0 |
| Attendance rate | 20% | 90/100 | 18.0 |
| Class participation (rubric) | 20% | 75/100 | 15.0 |
| Composite score | 100% | — | 84.8 |
The weighting is the decision that actually matters, and it’s also where schools disagree most. A district that weights attendance heavily will flag different students as at-risk than one that weights it lightly. If you’re building something like this, base your weights on what actually predicts outcomes at your institution rather than copying a generic formula wholesale.
API vs GPA vs AYP: Where the Terms Actually Differ
| Term | What It Measures | Level | Still Active? |
|---|---|---|---|
| GPA | Individual student’s average grade across courses | Student | Yes, universal |
| California API | Composite school accountability score (200–1000 scale) | School/District | No — retired 2013, replaced by CA Dashboard |
| AYP | Whether schools met federally set proficiency targets (NCLB) | School/District | No — replaced by ESSA state plans (2015–16) |
| Faculty API (UGC/CAS) | Points-based scoring of teaching, research, and service | Individual faculty | Yes, in Indian higher education |
The Faculty Version: UGC’s Career Advancement Scheme
If you landed here from a university HR context, this is your section. Under India’s UGC 2016 Regulations, “Academic Performance Indicator” refers to a points system faculty accumulate for promotion, split across three categories: teaching and learning activities, professional development and extension work, and research contributions such as publications, citations, and conference papers. A peer-reviewed journal article typically earns more points than a non-refereed publication, with further points added for indexed or high-impact-factor journals. Beyond sharing a name, this system has no connection to the student- or school-level indicators covered above.
How Schools Automate This Instead of Tracking It by Hand
Compiling weighted scores across hundreds of students by hand doesn’t scale, so most schools now run this through software instead of spreadsheets.
Learning Management Systems like Moodle or Canvas already capture grades, submission timing, and participation as a byproduct of normal use, which makes them the natural starting point rather than a separate system to build. Student Information Systems handle the administrative layer — attendance, demographics, behavioral logs — that feeds into the composite score alongside academic data. Analytics platforms sit on top of both, applying pattern recognition to flag at-risk students earlier than a manual review typically would, and increasingly suggest interventions rather than just surfacing raw scores.
The real advantage isn’t the time saved on data entry. It’s catching a sudden attendance drop or a slipping submission pattern while there’s still time to intervene, instead of finding out at the end of a grading period when the trend has already hardened.
Where These Systems Break Down
Tracking fifteen indicators with equal weight tells you less than tracking five with a clear priority order — if everything matters equally, nothing is actionable. California’s original API ran into a related problem: a single public number gave schools an incentive to optimize for the score itself rather than for actual learning, which is a large part of why the Dashboard replaced it with multiple measures instead of one. Any indicator system should start a conversation about what’s happening with a student or a school, not settle it.
Automated tracking adds two more risks worth naming plainly. Continuous data collection on attendance, behavior, and academics raises real questions about storage, access, and retention. And analytics tools trained on historical data can quietly reproduce the same disparities baked into that data. Neither is a reason to skip automation — it’s a reason to keep a human reviewing the output before any indicator drives a consequential decision.
A Practical Checklist for Building or Choosing Indicators
- Define what decision the indicator is meant to support before choosing the metric
- Pair at least one leading indicator, like attendance or engagement, with lagging ones like test scores and GPA
- Set weights based on what predicts outcomes at your institution, not a generic template
- Recalibrate at least once a year — student populations and curricula shift
- Pair any quantitative indicator with a qualitative check before it drives a high-stakes decision
- Avoid single-number composites for anything used publicly or punitively
FAQ
Is the California Academic Performance Index still used?
No. It was suspended in 2013 and formally replaced by the California School Dashboard, which reports multiple measures instead of one composite score.
What’s the difference between API and GPA?
GPA measures one student’s average grades. API, in its school-accountability sense, measured an entire school’s composite performance. They sit at completely different levels and aren’t interchangeable.
How do you calculate an academic performance index for a student?
Most schools use a weighted formula combining test scores, assignment completion, attendance, and participation, as shown in the worked example above. There’s no single universal formula — weighting varies by institution.
Do colleges use API in admissions decisions?
Colleges generally look at GPA, test scores, and course rigor directly rather than a composite API. School-level Dashboard data matters more to families choosing a school than it does to college admissions itself.
What is API in the university faculty context?
A points-based scoring system under UGC’s Career Advancement Scheme in India, used to evaluate teaching, research, and service for promotion. It has no connection to student performance tracking.